Coming from Excel
Spreadsheet work — filters and VLOOKUPs, month-end reconciliation, member lists and reports, a "database" that is a very large sheet — maps onto Flowfile almost concept for concept. What changes is the form: every step becomes a visible, repeatable node instead of something buried in cell references, and re-running last month's work on this month's file means pointing the flow at it and pressing Run.
1. Sheets become flows
An Excel workflow usually lives in one sheet: raw data on the left, helper columns in the middle, a pivot table somewhere else — and the order of operations isn't written down anywhere. In Flowfile that same work is a flow: a left-to-right chain of steps on a canvas, where each step shows its output data underneath. The logic isn't hidden in cells; it is the picture.
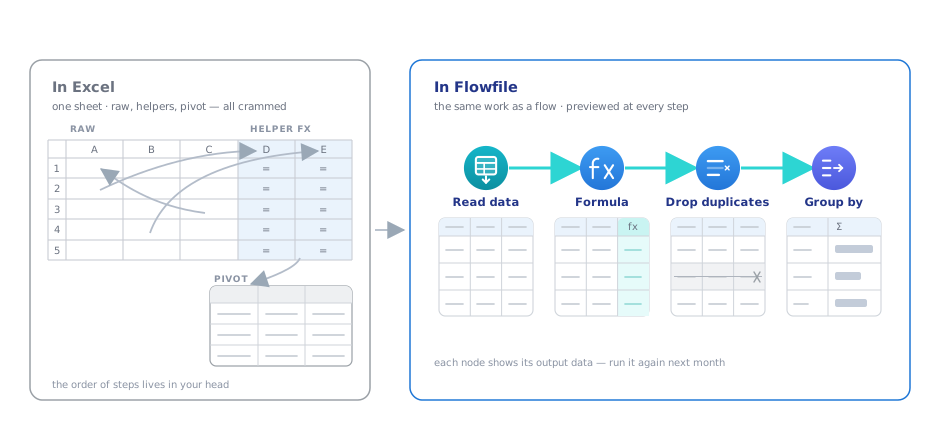
| In Excel | In Flowfile |
|---|---|
| A sheet of rows | A table flowing from node to node, previewed at every step |
A formula column (=IF(...)) |
A Formula node |
| VLOOKUP / XLOOKUP | A Join node |
| A pivot table | Group By or Pivot nodes |
| Data → Remove Duplicates | A Drop Duplicates node |
TRIM, CLEAN, PROPER helper columns |
A Data Cleansing node — nulls, whitespace, and casing in one step |
| Filter and sort buttons | Filter and Sort nodes |
| Redoing the steps by hand next month | Re-running the flow — or scheduling it |
| Save As → .xlsx | A Write Data node — Excel, CSV, or Parquet |
2. Your formulas still work
This is the part that transfers almost verbatim. Flowfile's formula language reads like the formula bar: reference columns by name in square brackets instead of by cell, and write conditions as if … then … else … endif:
| Excel | Flowfile formula |
|---|---|
=IF(B2>100,"High","Low") |
if [amount] > 100 then "High" else "Low" endif |
=ROUND(B2*C2,2) |
round([price] * [quantity], 2) |
=A2&" "&B2 |
concat([first_name], " ", [last_name]) |
=IFERROR(B2,0) (blank handling) |
ifnull([discount], 0) |
=TODAY() |
today() |
=DATEDIF(A2,TODAY(),"d") |
date_diff_days(today(), [hire_date]) |
Two differences: a formula applies to a whole column at once, so there is no dragging down — and boolean logic is written and / or rather than AND() / OR(). Past the translations, the formula language guide covers the language, the function reference is the full catalog, and the interactive playground lets you type formulas against sample data in the browser and watch results update live.
3. VLOOKUP is a Join
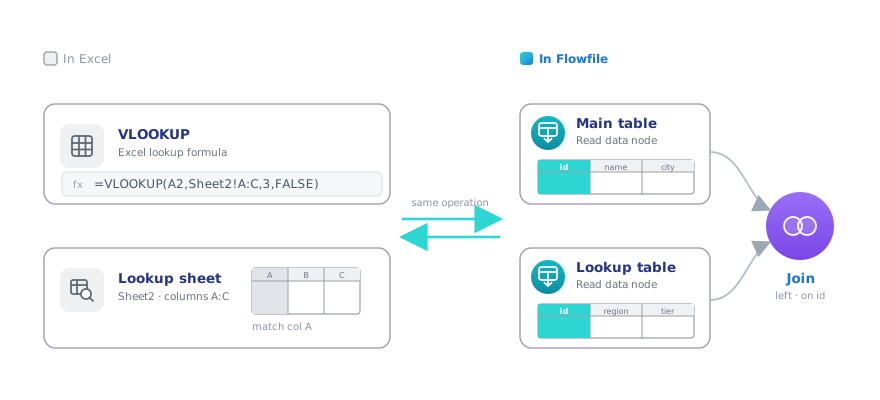
A VLOOKUP pulls columns from another sheet by matching a key. In Flowfile, that's a Join node with two inputs — your main table and the lookup table — matched on a key column. The generic flow, whatever your data:
- Two Read data nodes — the main table and the lookup sheet.
- A Join node, both connected, key column picked on each side.
- Join type left: every main-table row kept, matching columns attached, non-matches empty instead of
#N/A. (Inner keeps only matches — like deleting the#N/Arows afterwards.)
Where Excel needed the key in the first column and returned one column per formula, a Join matches on any column and brings the whole row. And for the case Excel can't do at all — "Acme Corp" vs "ACME Corporation" — the Fuzzy Match node joins on almost-equal keys.
4. Pivot tables are two nodes
Excel's pivot table does two jobs at once; Flowfile separates them into two nodes:
- Group By makes summary rows — one row per group with sums, means, medians, counts. "Total sales per city" is a Group By.
- Pivot spreads a category's values across the header — the "Columns" area of a pivot table — when a wide layout is genuinely the goal. Unpivot reverses it, turning wide month-columns back into tidy rows.
5. Where the spreadsheet runs out
Excel stops at 1,048,576 rows and gets painful well before that; Flowfile runs on Polars and doesn't have that ceiling. But the practical wins are about work, not just size:
- Repeatability — point the flow at next month's file and press Run. No redoing steps, no stale pivot caches, no "which cells did I fix by hand?"
- Transparency — every transformation is a labeled node a colleague can read, not a formula tucked into a helper column.
- A way out of files entirely — results can land in the catalog, where they're queried, charted, and refreshed on a schedule. The analyst route continues there.
6. Your first flow, in Excel terms
The Quickstart is a classic spreadsheet job done as a flow — and maps one-to-one onto what you'd have done in Excel: open the file (Read data), Remove Duplicates (Drop duplicates), filter to quantity > 7 (Filter with the formula [quantity] > 7), then a "pivot" of income per city (Group By with Sum and Median).
Start here: open the finished sales pipeline in your browser — the whole Excel job as a flow, nothing to install — then rebuild it yourself with the Quickstart.