Build flows visually
Recurring data preparation takes many forms: merging exports from two systems that don't talk, standardizing the files a partner sends every month, prepping inputs for a model, reconciling finance extracts, cleaning survey results. What they share is that the steps are manual and the sequence isn't written down anywhere.
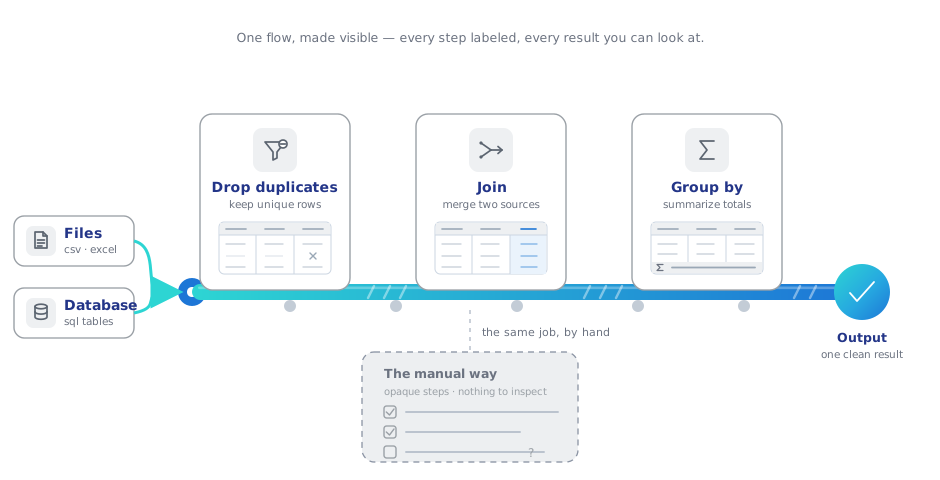
A flow replaces that with something that can be seen: every step a labeled node, every intermediate result inspectable, and the whole thing re-runnable by anyone.
1. Learn the canvas with one real flow
Nodes are operations, the connections between them carry the data, and after a run you can look inside any node. The Quickstart makes it concrete in five steps — read a sales export, drop duplicate rows, keep the bulk orders, summarize income per city — and Building Flows covers the mechanics: connecting, configuring, running, saving — about twenty minutes for both.
2. Know your toolbox
Most flows lean on the same five nodes: Read data, Filter data, Formula, Join, and Group by. Node names say what they do to the data (Drop duplicates, Text to rows, Fuzzy match), and Data Actions lists every one of them — Input Sources, Transformations, Combine Operations, Aggregations, Machine Learning, Output Operations — with a lookup by what you want to do.
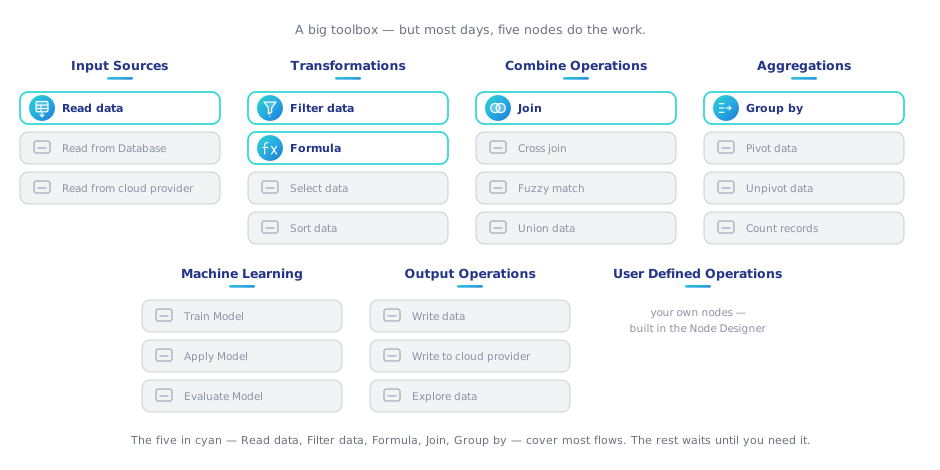
And if the palette doesn't have the operation you need, you can add it yourself — the Node Designer builds a custom transformation into a real palette node with its own settings form, no code file to write by hand. More on that in Grow the toolkit.
3. Write the logic as formulas
Derived columns and filter conditions use the formula language — column names in brackets, functions and conditionals like a spreadsheet, compiled to native Polars underneath. A margin flag looks like:
if [gross_income] / [unit_price] > 0.3 then "high margin" else "standard" endif
and a cleanup like:
trim(uppercase([customer_code]))
The function reference lists everything available, and the interactive playground lets you try an expression against sample data before committing it to a node.
4. Build in Development, ship in Performance
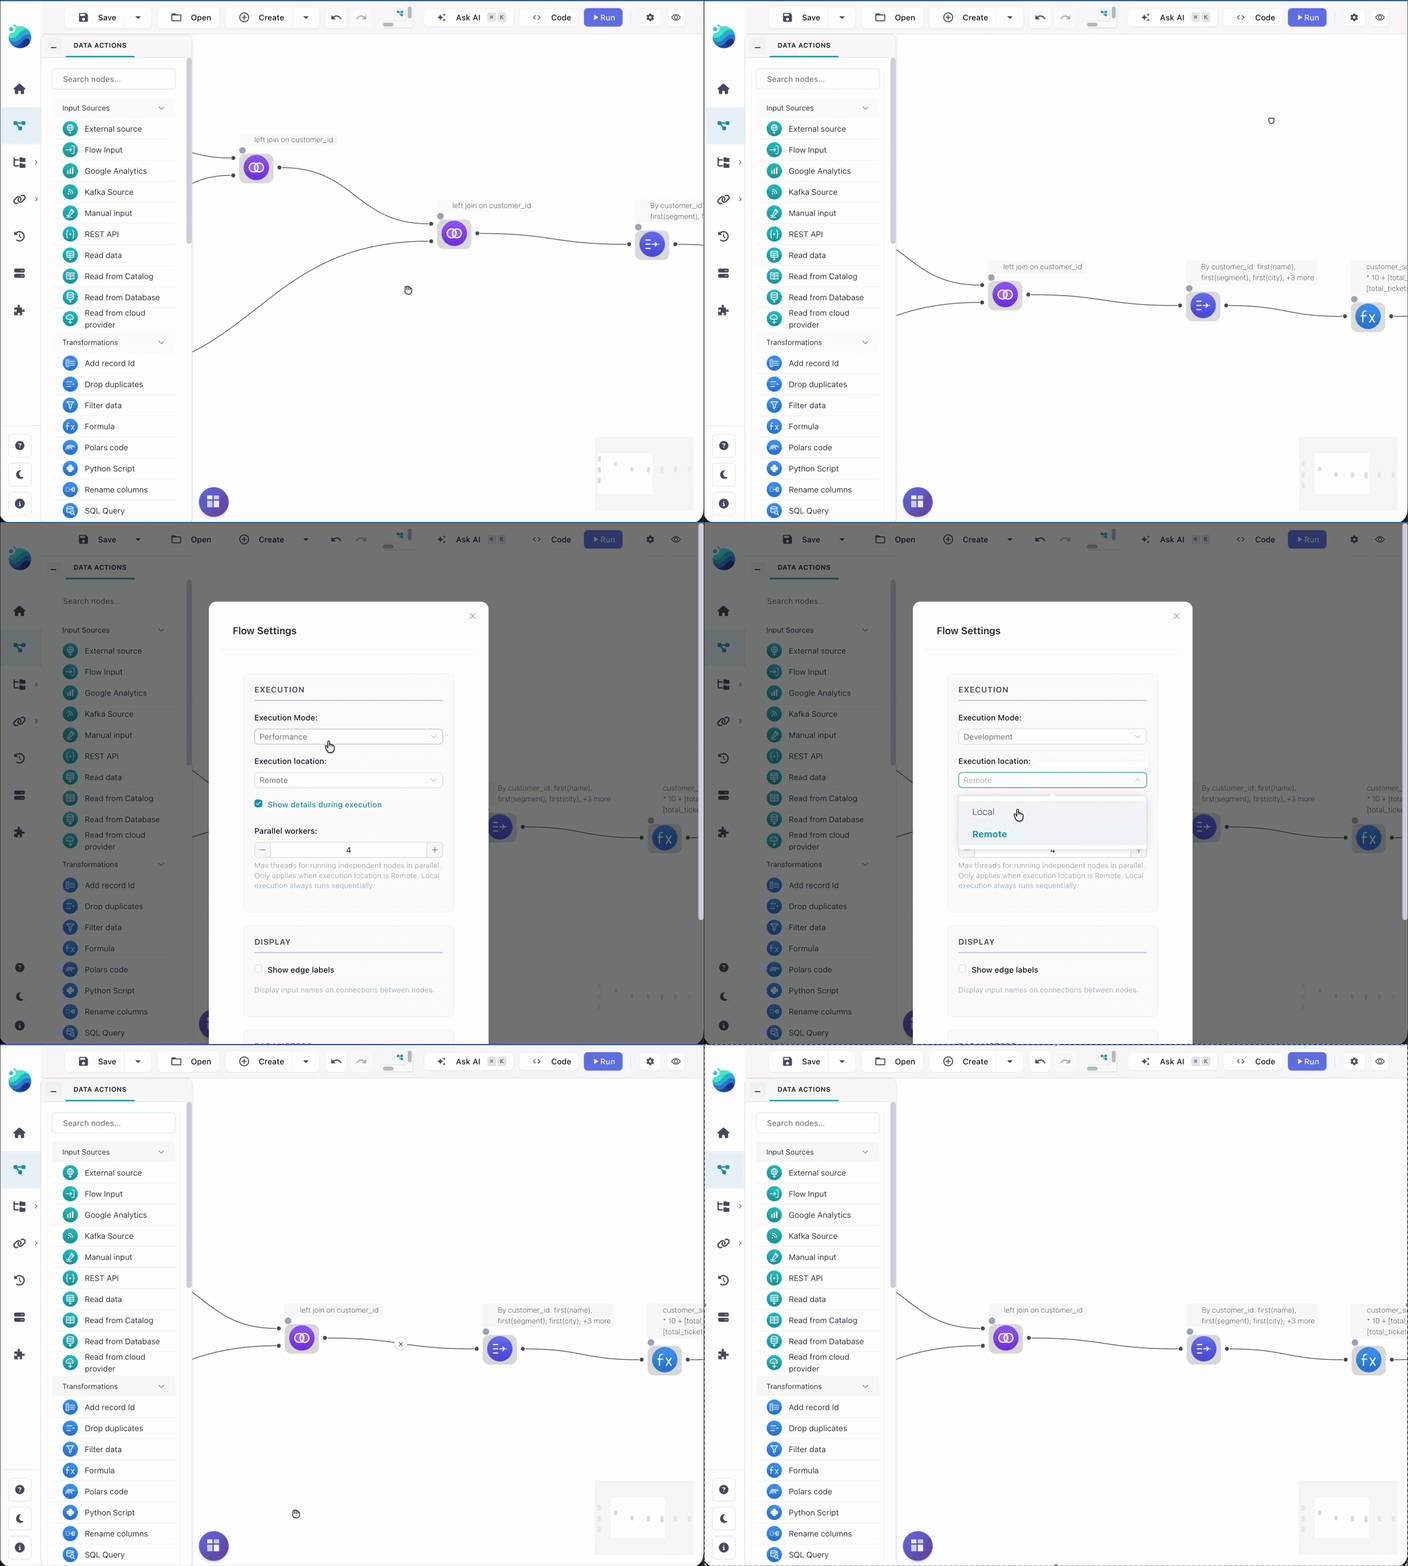
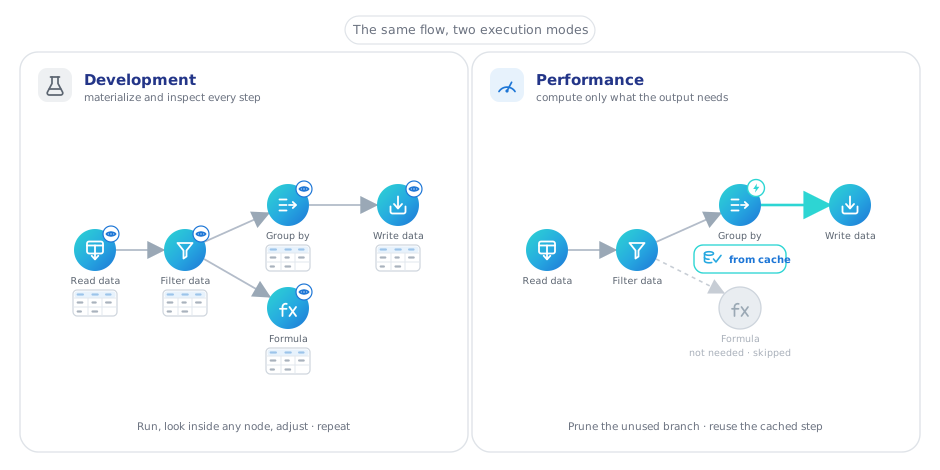
This is one toggle, not a migration. Development — the default while you build — runs every node and keeps its result, so you can inspect each step: run, look, adjust, run again. Performance computes only what the outputs actually need and optimizes across the whole flow, so nothing is calculated for a preview nobody's looking at. You switch in Flow Settings; the flow itself never changes, and scheduled or headless runs use Performance on their own.
See it: the execution mode in Flow Settings
Caching is separate and per-node: a node's Cache results toggle (in its General Settings) stores that node's output so a Performance run — and your downstream edits — reuse it instead of recomputing. The saving is largest on an expensive step whose inputs rarely change.
5. Deliver the result
Each kind of consumer has a natural landing place:
- A colleague who wants a file — Write data to Excel, CSV, or Parquet, and you're done.
- People who'll query, chart, or build on it — Write to Catalog. The result becomes a versioned table with history and lineage, and the analyst route takes over from there.
- Another system — Database and Cloud Storage writers push results back into the warehouse or the bucket, via saved connections.
6. Automate what you built
A finished flow doesn't need you to press Run. Open Schedules in the app and set the flow to run on a schedule — every night, every Monday — or whenever a table it depends on is updated. No files, no command line: a fresh source cascades into fresh results on its own.
Run it somewhere else — CI, cron, another host
Flows are plain .yaml files, so anything that can run a command can run one:
flowfile run flow monthly_reconciliation.yaml --param month=2026-07
Exit code 0 or 1, no UI — cron jobs and CI pipelines treat it like any other tool. The CLI reference covers parameters and the packaged variants, and Projects version the whole workspace in git.
7. Grow the toolkit
Three things to reach for as the collection grows:
- Repeated node chains become a subflow — a flow with named inputs and outputs that other flows call, including once-per-row over a parameter table.
- A missing operation becomes a palette node in the Node Designer, with its own settings form, reusable across every flow.
- A readable version of a flow comes from exporting it as Python. Pure-transformation flows export as Polars with no
flowfileimport; flows with I/O nodes keep anffimport for their connections. Either way, the logic is readable by anyone who reads code.
Start here: open the finished sales pipeline in your browser — nothing to install — then rebuild it yourself with the Quickstart.