Building Flows
Flowfile allows you to create data pipelines visually by connecting nodes that represent different data operations. This guide will walk you through the process of creating and running flows.
Looking for a quickstart overview?
Check out our Quick Start Guide to get up and running in minutes.
Interface Overview
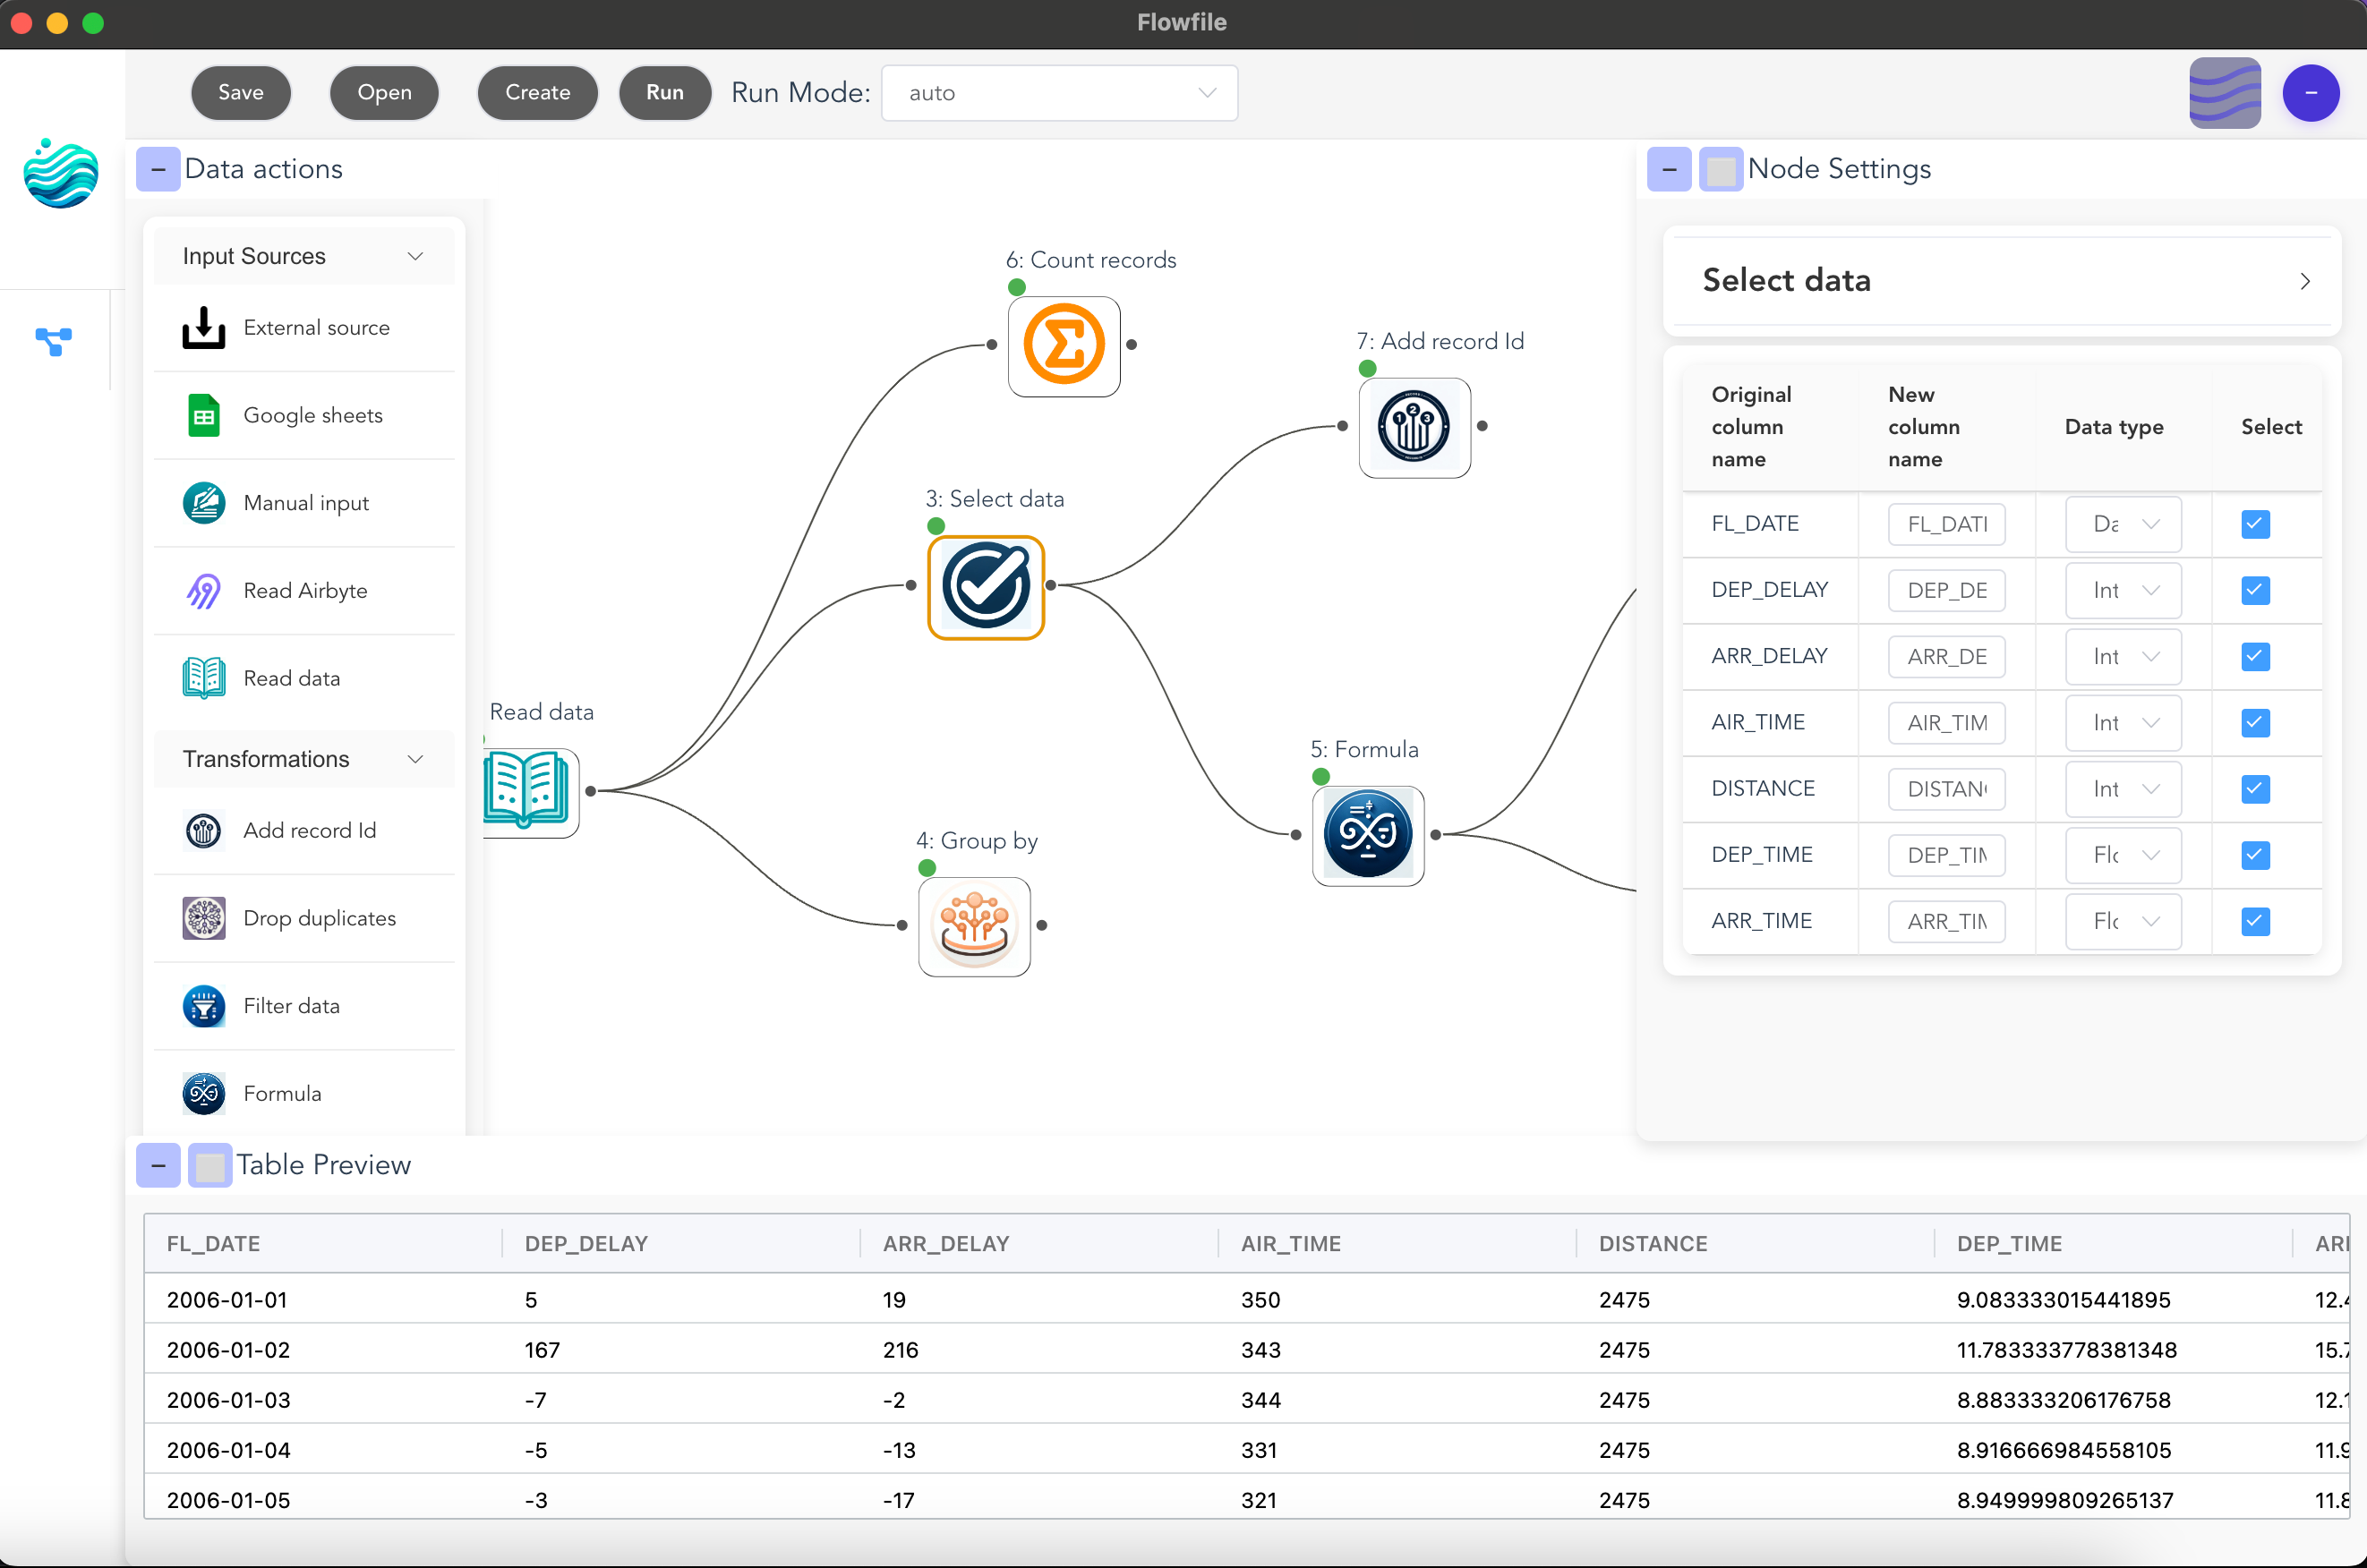
The complete Flowfile interface showing:
- Left sidebar: Browse and select from available nodes
- Center canvas: Build your flow by arranging and connecting nodes
- Right sidebar: Configure node settings and parameters
- Bottom panel: Preview data at each step
Creating a Flow
Starting a New Flow
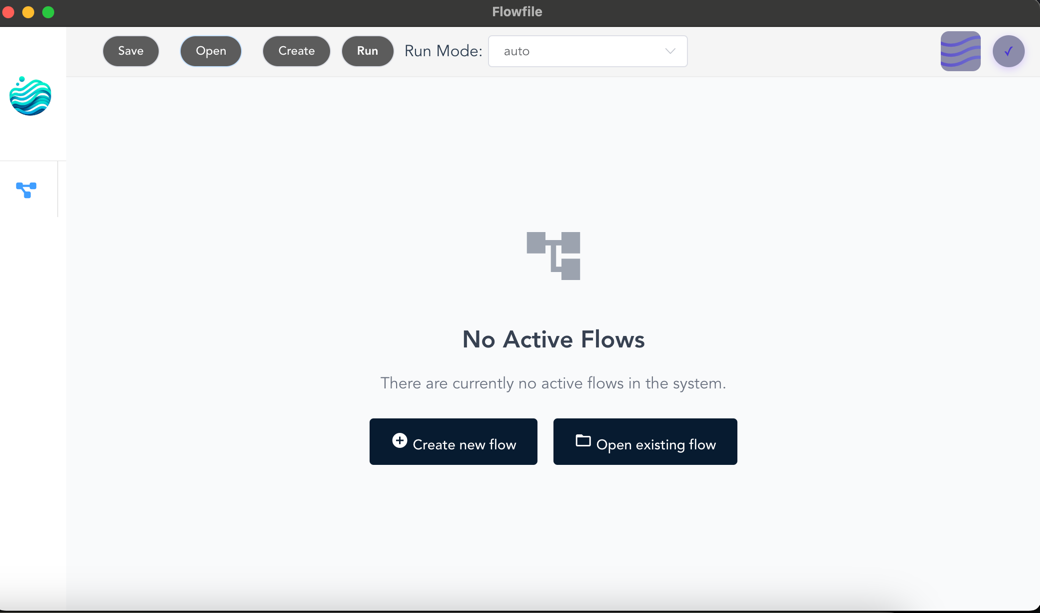
- Click the Create button in the top toolbar
- A new empty canvas will open
- Save your flow at any time using the Save button
- Flows are saved as
.yamlor.jsonfiles (human-readable formats)
Adding Nodes
- Browse nodes in the left sidebar, organized by category:
- Input Sources (for loading data)
- Transformations (for modifying data)
- Combine Operations (for joining data)
- Aggregations (for summarizing data)
- Output Destinations (for saving data)
- Drag any node onto the canvas
- Connect nodes to create a flow
Configuring Nodes
Node Settings
Click any node on the canvas to open its settings in the right sidebar. Each node type has unique configuration options tailored to its function.
For example, the "Formula" node shown here includes sections for:
- 🎛️ General: Add a custom description via general settings
- ⚙️ Performance tweaking: Define if the data needs to be cached for better performance via general settings
- ↔️ Transformations: Define the formula to be applied on the incoming data
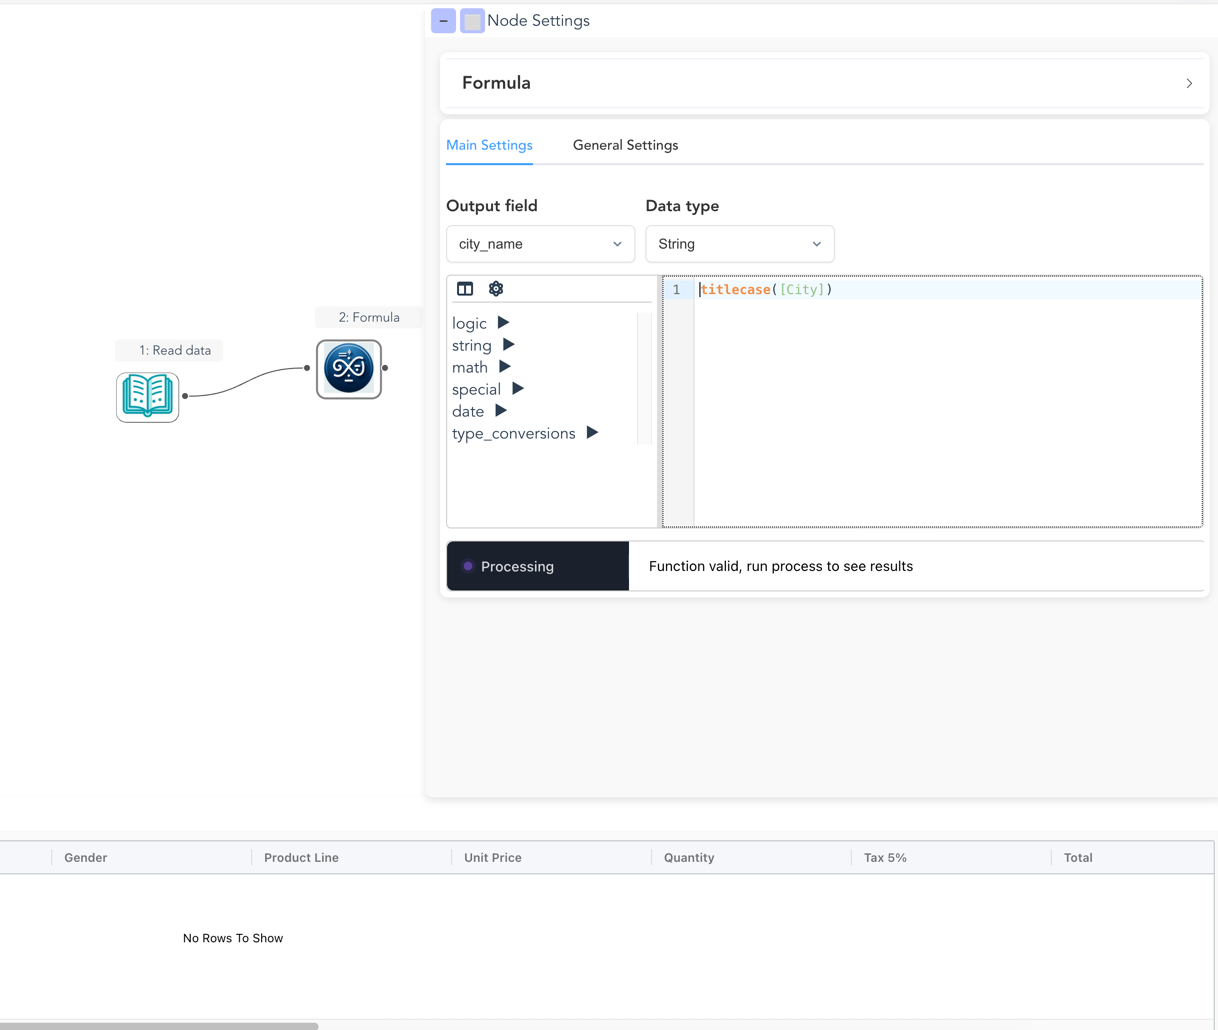
The settings panel for a "Formula" node.
Data Preview
- After configuration, each node shows the output schema of the action
- Click on the run button to execute the node
- The preview panel will show the output data
Running Your Flow
1. Flow Settings
Open the settings modal by clicking the gear icon in the top toolbar. This modal controls how your flow executes and how connections are displayed on the canvas.
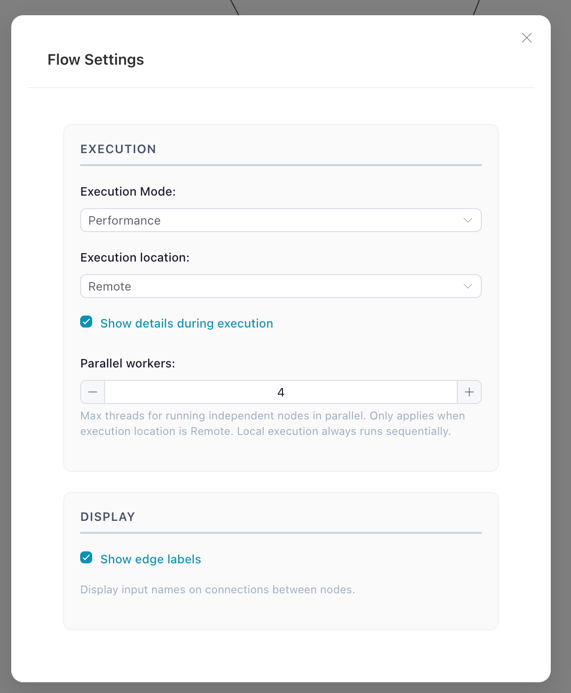
The Flow Settings modal showing execution mode, location, display options, and parallel workers
Execution Mode
| Mode | Description |
|---|---|
| Development | Lets you view the data in every step of the process, at the cost of performance |
| Performance | Only executes steps needed for the output (e.g., writing data), allowing for query optimizations and better performance |
Execution Location
| Location | Description |
|---|---|
| Local | Runs the flow in the core process. Nodes execute sequentially. |
| Remote | Offloads execution to the worker service. Enables parallel execution of independent nodes. |
Show Edge Labels
When enabled, each connection on the canvas displays its connection name as a label on the edge. The name is derived from the source node's node reference (or defaults to df_{node_id} if no reference is set).
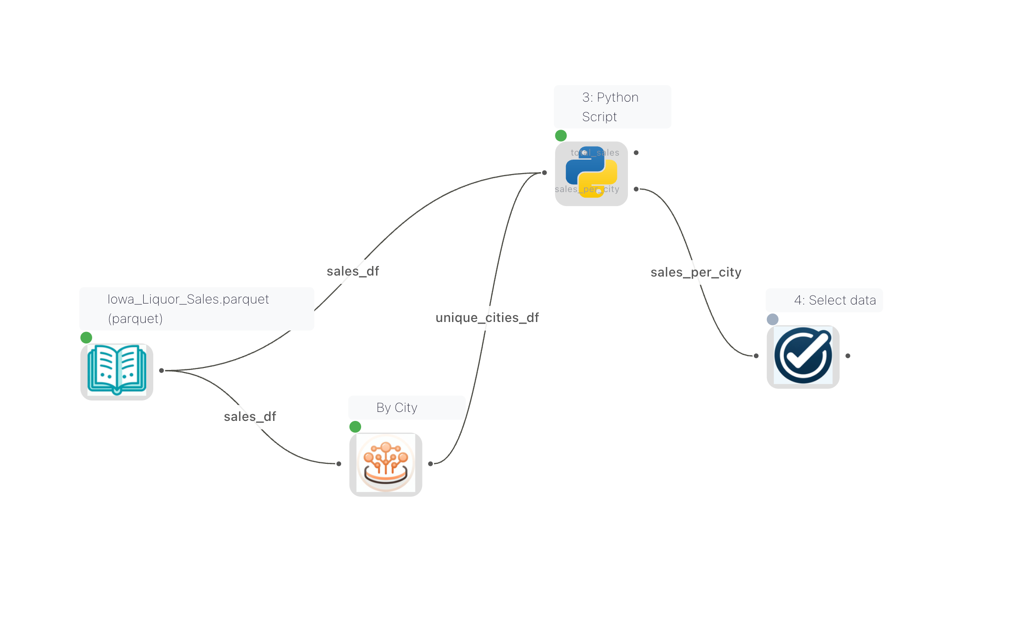
Edge labels displayed on connections, showing the name of each data stream
This is especially useful when working with Python Script (kernel) nodes, where edge labels tell you the exact name to pass to flowfile_ctx.read_input(). For example, if two nodes with references total_sales and sales_per_city are connected to a Python Script node, you read them like this:
total_sales = flowfile_ctx.read_input("total_sales")
sales_per_city = flowfile_ctx.read_input("sales_per_city")
Similarly, Python Script nodes can publish multiple named outputs using flowfile_ctx.publish_output(df, "name"), with output names configured visually in the node settings. See Kernel Execution — Writing Output Data for details.
Show Detailed Progress
When enabled, the execution progress indicator shows more granular status updates for each node during a flow run.
Parallel Workers
Controls how many independent nodes can run concurrently during flow execution.
| Setting | Details |
|---|---|
| Range | 1–32 |
| Default | 4 |
| Applies to | Remote execution only (Local always runs sequentially) |
Increasing the number of parallel workers can speed up flows with many independent branches. Reduce it if the worker machine has limited CPU or memory.
2. Running the Flow
- Click the Run button in the top toolbar
- Watch the execution progress:
- 🟢 Green: Success
- 🔴 Red: Error
- 🟡 Yellow: Warning
- ⚪ White: Not executed
3. Viewing Results
- Click any node after execution to see its output data
- Review the results in the preview panel
- Check for any errors or warnings
- Export results using output nodes
Saving and Loading Flows
Flowfile saves your pipelines as human-readable YAML or JSON files, making them easy to version control, share, and collaborate on.
Supported Formats
| Format | Extension | Best For |
|---|---|---|
| YAML | .yaml, .yml |
Human readability, version control |
| JSON | .json |
Programmatic access, API integration |
Saving a Flow
- Click the Save button in the toolbar
- Choose a filename with
.yamlor.jsonextension - Your flow is saved with all nodes, connections, and settings
What Gets Saved
- Flow settings: Name, description, execution mode
- All nodes: Type, position, and configuration
- Connections: How nodes are linked together
- Node settings: All parameters and options
Loading a Flow
- Click Open in the toolbar
- Select a
.yaml,.json, or legacy.flowfile - The flow is fully restored and ready to run
Version Control
YAML files work great with Git:
- Track changes to your pipelines over time
- Review diffs to see what changed
- Collaborate with team members
- Roll back to previous versions
Migrating from Legacy Format
If you have flows saved in the old .flowfile format, simply open them and save as .yaml to convert.
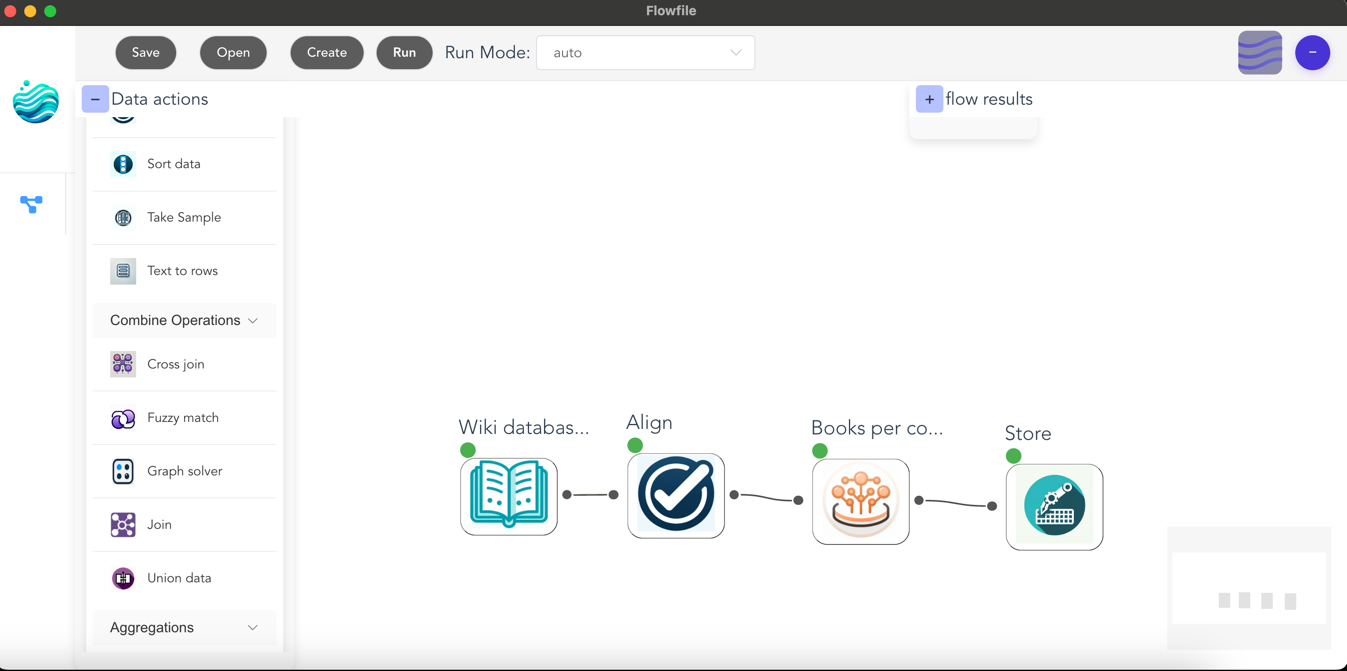
Example Flow
Here's a typical flow that demonstrates common operations:
Best Practices
Organization
- Give your flows clear, descriptive names
- Arrange nodes logically from left to right
- Group related operations together
- Use comments or node labels for documentation
Development
- Save your work frequently
- Test with a subset of data first
- Use the auto-run mode during development
- Break complex flows into smaller, manageable parts
Troubleshooting
- Check node configurations if errors occur
- Review data previews to understand transformations
- Ensure data types match between connected nodes
- Look for error messages in node status
Tips and Tricks
-
Node Management:
- Double-click canvas to pan
- Use mouse wheel to zoom
- Hold Shift to select multiple nodes
- Right-click for context menu
- Right-click on the text to add notes
-
Data Handling:
- Use sample nodes during development
- Preview data frequently
- Check column types early with select nodes
Want to see another example?
Checkout the quickstart guide!
Next Steps
After mastering basic flows, explore: