Visualizations
Save interactive charts in the catalog and reopen them whenever you need them. A visualization sits on top of a catalog table or an inline SQL query and is built with Graphic Walker, so dragging fields onto axes, switching aggregations, and filtering happen live against the underlying data.
Limited in Flowfile Lite
The browser-only Flowfile Lite edition can explore data interactively with Graphic Walker (the Explore Data node), but saving visualizations to the catalog requires the full desktop/server build.
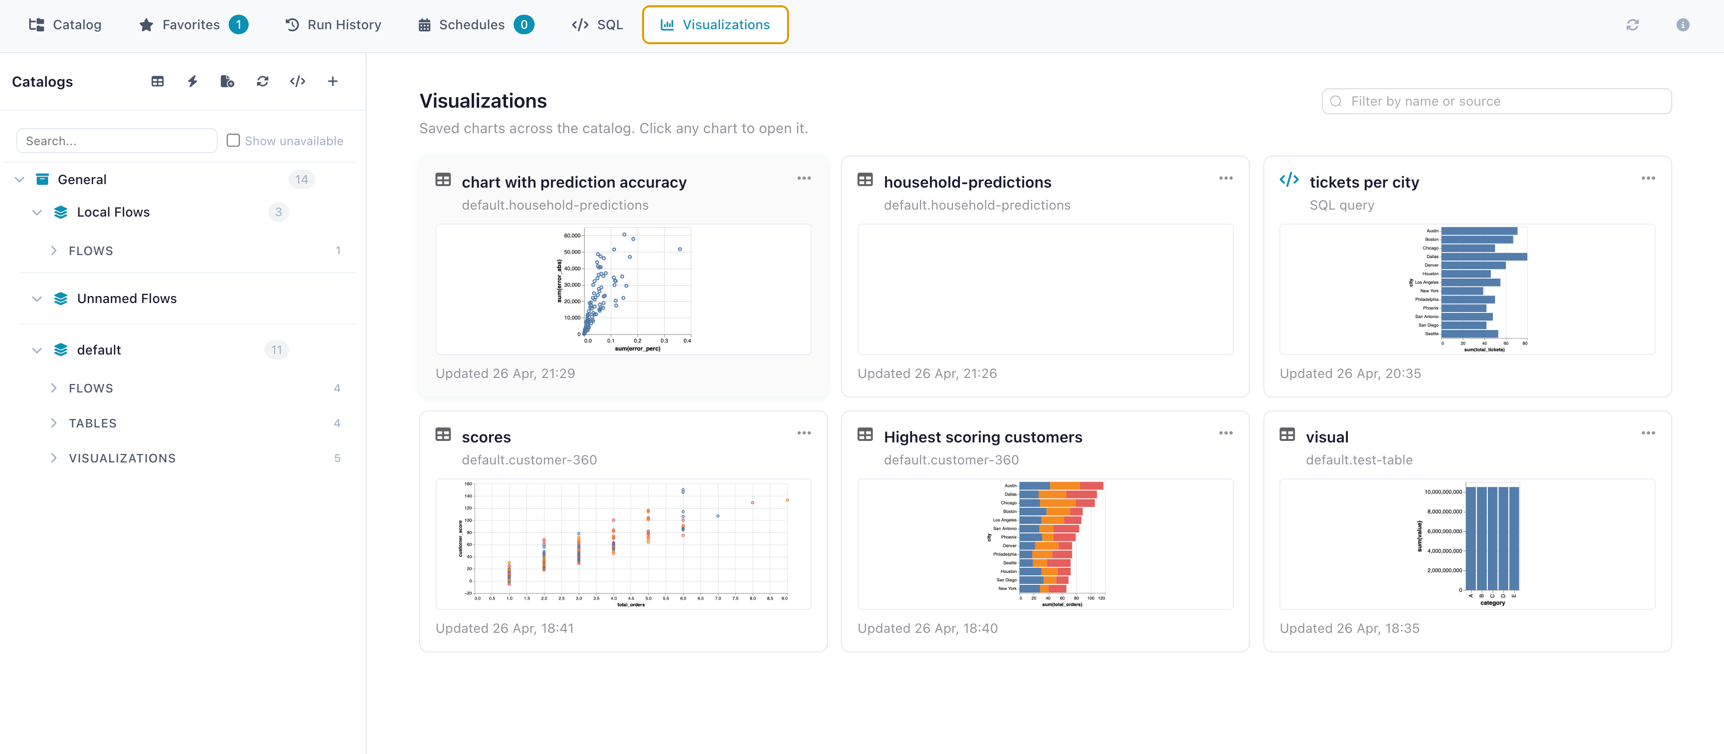 The Visualizations library — saved charts as cards with thumbnails, filtered by namespace.
What a visualization is
A visualization is a saved chart specification — not a copy of the data. It contains:
| Field | What it stores |
|---|---|
| Name and description | How you find it in the library |
| Chart spec | The Graphic Walker layout (axes, marks, filters, multi-tab dashboards) |
| Source | Either a catalog table or an inline SQL query |
| Namespace | Where it lives in the catalog tree (independent of the source's namespace) |
| Thumbnail | A small PNG captured at save time, used to preview cards in the library |
Because the data isn't embedded, every time you open a saved visualization it queries the current state of the source. Updating the underlying table immediately changes what the chart shows.
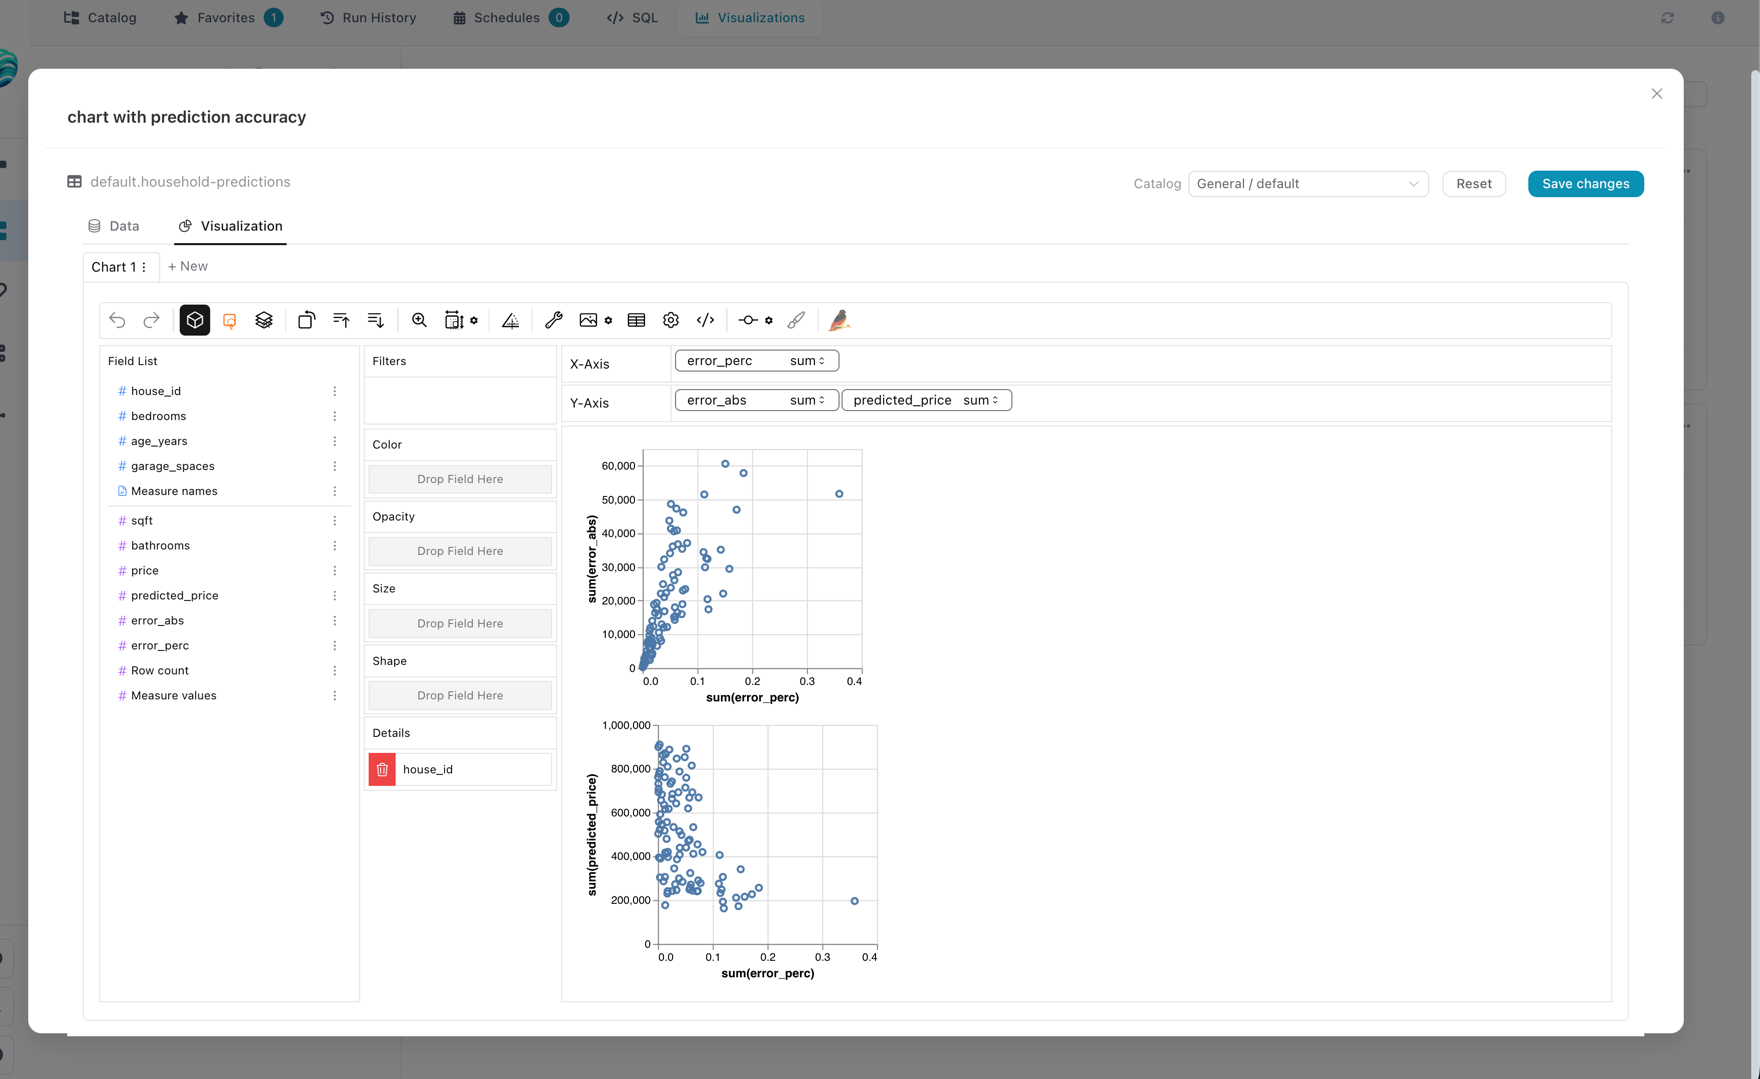
Creating a visualization
There are two starting points.
From a catalog table
- Open a table's detail panel in the Catalog.
- Switch to the Visualizations tab and click Create Visualization.
- The Graphic Walker editor opens with the table's columns already available as fields.
- Drag fields onto the axes, pick the chart type, set filters and aggregations.
- Click Save and give the visualization a name.
From a SQL query
- Open the SQL Editor.
- Run any query you want as the source.
- Click Save as Visualization.
- The editor opens with the query's result columns as fields.
- Build the chart and save.
The chart will re-execute the SQL each time it's opened, so it always reflects the latest data in the referenced tables.
The Visualizations library
The catalog has a top-level Visualizations tab that lists every saved visualization across all namespaces. Each card shows:
- The chart's thumbnail
- Name, source type (table / SQL), and the source's name
- Last-edited timestamp
Click a card to open the visualization in viewer mode. From there you can edit, rename, or move it between namespaces.
A per-table view is also available from each table's detail panel — that one only lists visualizations whose source is that table.
Editing and reorganising
From a visualization's detail panel you can:
- Edit the chart spec — opens Graphic Walker again with the saved layout pre-loaded.
- Rename or change the description.
- Move the visualization to a different namespace. The source link is unaffected — a visualization can live anywhere in the catalog tree, regardless of where its source table lives.
- Update the thumbnail — saving an edited chart re-captures the thumbnail automatically.
- Delete — removes only the visualization. The underlying table or SQL is never touched.
What happens when the source changes
A visualization is a pointer to its source, not a copy. Concretely:
- Source table updated — the chart shows the new data on next open. No save required.
- Source table deleted — the visualization becomes "orphaned". It still appears in the library but the source name shows as missing; opening it for edit will fail until you reassign or delete it.
- Source schema changed — fields that no longer exist drop out of the saved spec; the chart re-renders with the remaining ones.
- SQL source's referenced tables change — the SQL is re-resolved on every open, so renaming or reassigning a referenced table can either fix or break a visualization depending on the change.
Multi-tab dashboards
Graphic Walker supports multiple chart tabs in a single workspace. Flowfile saves the whole workspace, so a single visualization entry can carry several charts. Switch between them in the editor exactly the way Graphic Walker normally allows; the saved spec round-trips all tabs.
Tips
- Use the same namespace as the underlying table when a visualization is the canonical chart for that table; use a separate namespace (e.g.
dashboards) when collecting cross-cutting views. - For the fastest editor experience, prefer table sources. SQL sources re-execute the query on every open; table sources load once and run every drag-and-drop against the warm dataset.
- Thumbnails are capped at 200 KB. Very large or very colourful charts may exceed that — Flowfile drops oversized thumbnails silently and falls back to the chart-type icon.
Related documentation
- Catalog overview — namespaces, tables, and registration
- SQL Editor — building SQL queries as visualization sources
- Virtual Flow Tables — using flow-produced tables as visualization sources
- For developers: Visualizations & Graphic Walker (architecture)