Deduplicate and summarize sales data
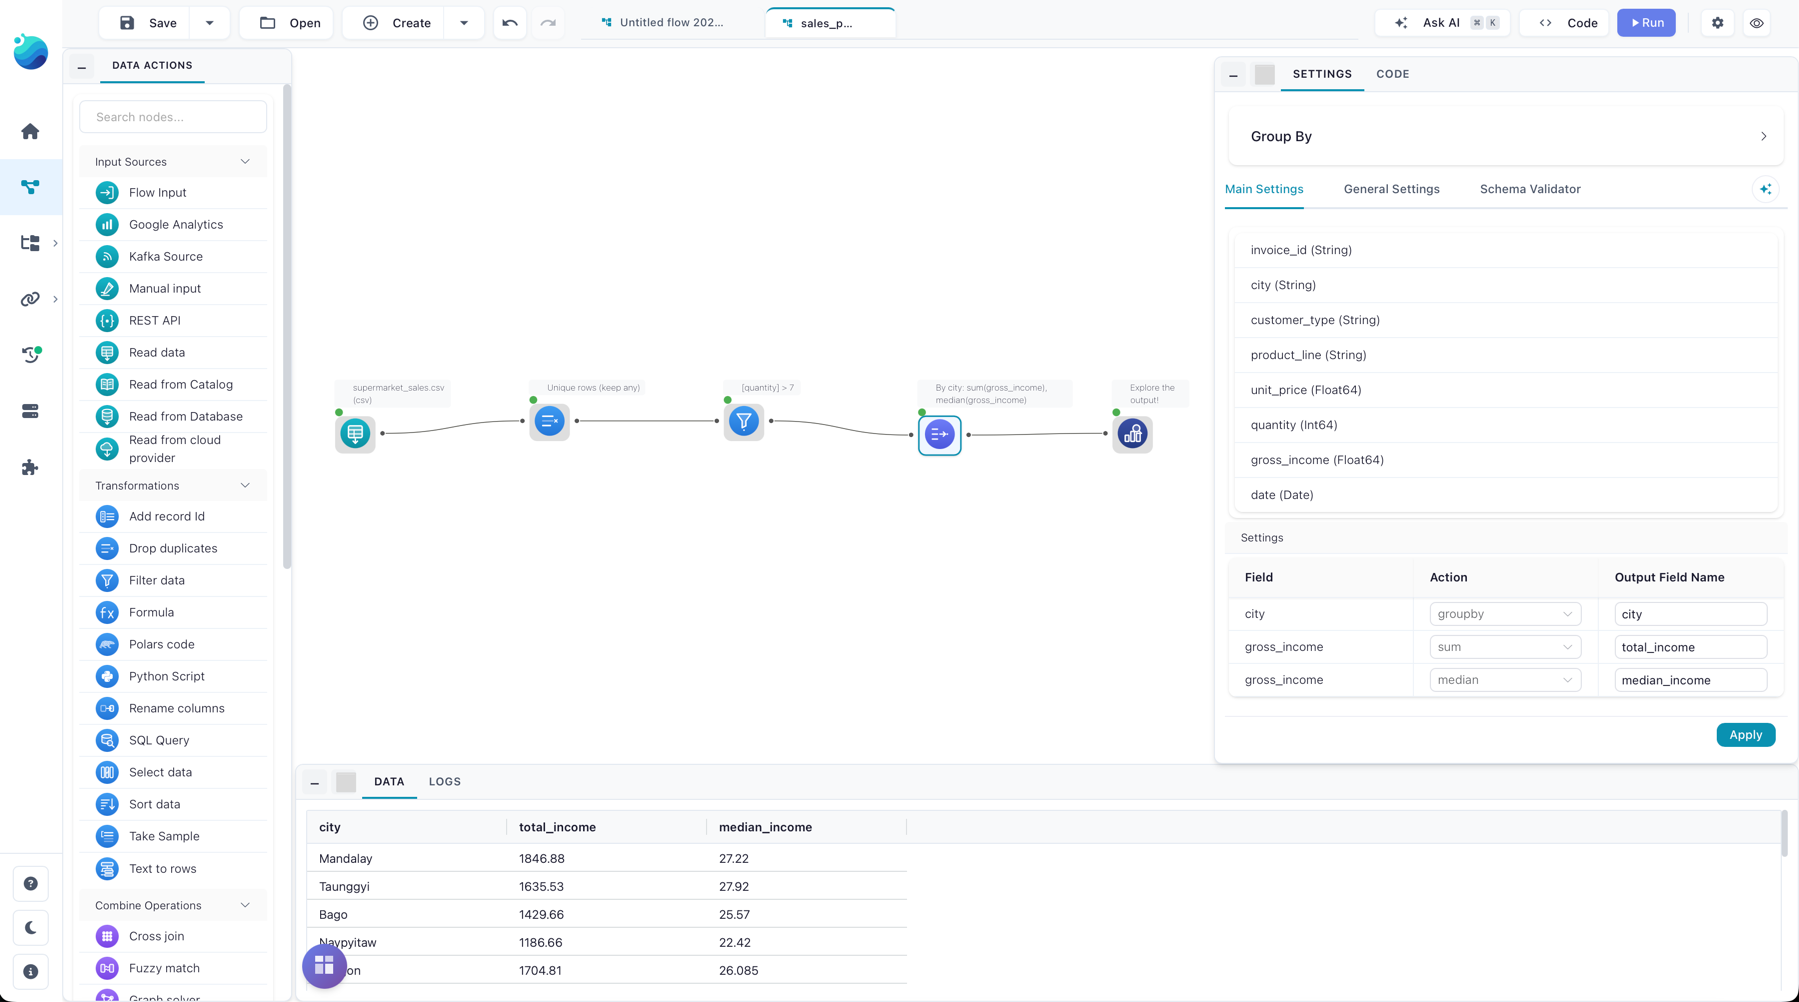
This example builds a five-node flow that cleans a raw sales export, keeps the high-quantity orders, and totals gross income per city. It's aimed at analysts new to Flowfile who want to see a full read → clean → filter → aggregate → explore pipeline end to end.
Flow: download sales_pipeline.yaml ·
In-app: Create → From template → "Sales pipeline: clean, filter, aggregate" · Data: data/templates/supermarket_sales.csv
The data
supermarket_sales.csv holds 1030 transaction rows — including 30 exact duplicate rows to clean up.
| Column | Meaning |
|---|---|
invoice_id |
Transaction identifier |
city |
Store city (Bago, Mandalay, Naypyitaw, Taunggyi, Yangon) |
customer_type |
Member or Normal |
product_line |
Product category |
unit_price |
Price per unit |
quantity |
Units sold |
gross_income |
Income for the line |
date |
Transaction date |
The flow
Five nodes, connected left to right:
- Read data — reads
supermarket_sales.csv(file type CSV). - Drop duplicates — strategy
any, no key columns, so it removes fully-identical rows (drops the 30 duplicates). - Filter data — advanced filter
[quantity] > 7, keeping only the higher-quantity orders. - Group by — groups by
city, with two aggregations ongross_income:sum→total_incomemedian→median_income
- Explore data — opens the result in the Graphic Walker explorer so you can chart it interactively.
Run it
Four ways to run this flow:
- In your browser, right now — open it in Flowfile Lite: the flow travels in the link and reads the sample CSV from its public URL — nothing to install. Click Run when it loads.
- From the template browser — Create → From template → "Sales pipeline: clean, filter, aggregate". This loads the flow with the sample data already wired in. Click Run.
- Download and open — grab
sales_pipeline.yamland open it in the designer. Its Read node points at the sample CSV's public URL, so it runs as-is with an internet connection — or repoint it at a local copy of the file. - Headless — once a flow is saved with a real data path, run it from the command line without opening the UI:
flowfile run flow path/to/your_flow.yaml
The result
Grouped per city, over the deduplicated rows with quantity > 7:
| City | total_income |
median_income |
|---|---|---|
| Bago | 1429.66 | 25.57 |
| Mandalay | 1846.88 | 27.22 |
| Naypyitaw | 1186.66 | 22.42 |
| Taunggyi | 1635.53 | 27.92 |
| Yangon | 1704.81 | 26.085 |
In Python
The same pipeline with the FlowFrame API — deduplicate, filter, group, aggregate — returns the identical per-city totals:
import flowfile as ff

SALES = "https://raw.githubusercontent.com/edwardvaneechoud/flowfile/main/data/templates/supermarket_sales.csv"

result = (
    ff.read_csv(SALES)
    .unique()
    .filter(ff.col("quantity") > 7)
    .group_by("city")
    .agg(
        ff.col("gross_income").sum().alias("total_income"),
        ff.col("gross_income").median().alias("median_income"),
    )
)
Variations
- Swap your data — point the Read node at your own CSV; the clean → filter → aggregate shape carries over to any sales-style export.
- Add more aggregations — the Group by node offers Sum, Mean, Median, Min, Max, Count, N-unique, First, Last, and Concat per column.
- Persist the result — replace the Explore data node with a Catalog Writer to save the summary as a catalog table, then chart it with a visualization.