
Flowfile
An open-source data platform with a visual pipeline builder, AI assistant, data catalog with Delta Lake storage, scheduling, Kafka ingestion, sandboxed Python execution, and a Polars-compatible API — installed with a single pip install.
An open-source data platform with a visual pipeline builder, AI assistant, data catalog with Delta Lake storage, scheduling, Kafka ingestion, sandboxed Python execution, and a Polars-compatible API — installed with a single pip install.
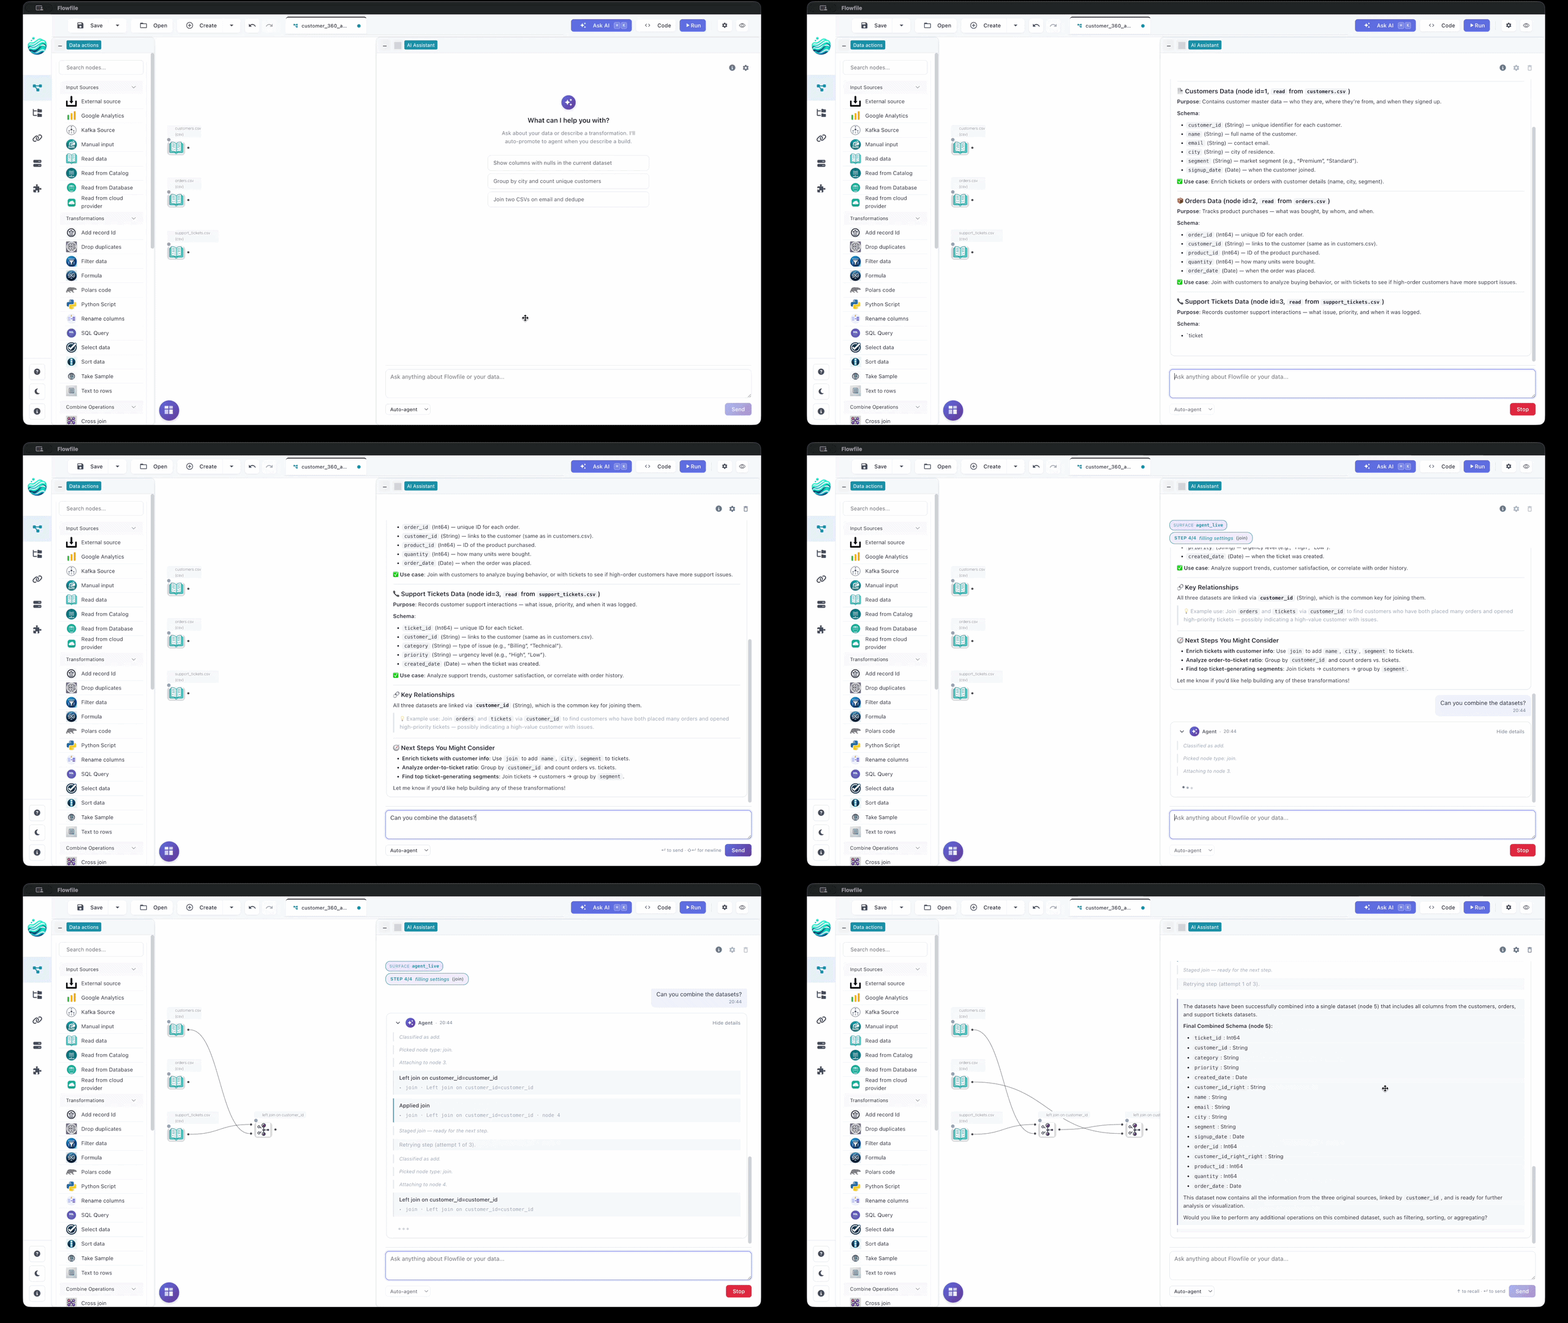
A complete data platform built on Polars — every part works with every other part
40+ nodes for joins, filters, aggregations, fuzzy matching, pivots, and more — with a data preview at every step.
→Build pipelines from natural-language prompts, ask questions about a flow you didn't write, and turn failed runs into one-paragraph diagnoses. Bring your own provider — Anthropic, OpenAI, Google, Groq, OpenRouter, or a local Ollama.
→Tables stored as Delta Lake with version history and time travel. Namespaces, lineage, run history, and virtual tables in one place.
→Query any catalog table in the SQL editor, explore results in Graphic Walker visualizations, and save the charts next to the data.
→Run flows on intervals or trigger them when catalog tables update. Built into the catalog — not a separate orchestration tool.
→Ingest from Kafka/Redpanda as a canvas node. Read and write S3, Azure Data Lake, and GCS. Connect PostgreSQL, MySQL, SQL Server, SQLite, and DuckDB.
→Run arbitrary Python in isolated Docker containers. Use any library — the output flows back into the pipeline.
→Export visual flows as readable Python/Polars scripts, or build pipelines in code with a Polars-compatible API and open them on the canvas.
→Build your own node visually in the Node Designer — it saves as a single .py file and appears in the palette next to the built-ins. Install nodes others have published, or publish your own to the community registry.
→The same sales pipeline — cleaned, filtered, and aggregated — on the canvas and in Python. Both produce the same flow; switch whenever you like.
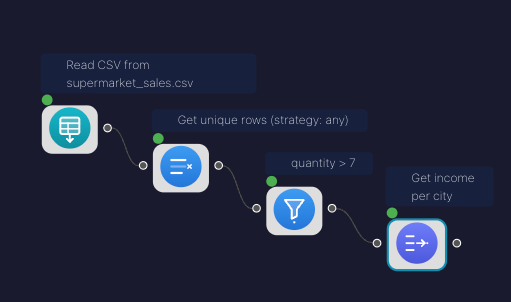
Read data → Drop duplicates → Filter data → Group by, you can preview data at each step.
import flowfile as ff

df = ff.read_csv("data/templates/supermarket_sales.csv")

result = (
    df.unique()
    .filter(ff.col("quantity") > 7)
    .group_by("city")
    .agg(
        ff.col("gross_income").sum().alias("total_income"),
        ff.col("gross_income").median().alias("median_income"),
    )
)

print(result.collect())Also available in the app: Create → From template → "Sales pipeline". The flow and the code above are validated by the test suite on every commit.
Pick the guide written for the way you work
Turn spreadsheet exports into pipelines everyone can see and re-run.
VLOOKUP, pivot tables, and IF-formulas, translated to flows.
Warehouse, S3, Kafka, GA — work with data where it already is.
From question to chart, refreshed on a schedule.
A Polars-compatible API that builds visual flows as a side effect.
Auth, secrets, sharing, and backups for a multi-user deployment.
One install gives you the visual editor, the Python API, the catalog, and all services.
pip install flowfileMIT licensed, developed on GitHub